One of the most frequent questions we get is "How many foreclosures are there in the market?"
While foreclosures, REO's, and short sales, which comprise the distresses property segment, are affecting the market, the impact they have on one home or subdivision to the next can vary significantly. Contact the Bakers with questions on this subject.
Here are percentages of
distressed single-family homes closed in each town in
6-month segments. For example 23% of all single family sales in
Arlington in the first half of 2012 were distressed
properties.
12/2/12-6/9/12 and 6/9/12-12/10/12.
To the right are the percentages of distressed homes for
sale in the market at the end of 2012.
A "zombie foreclosure" is a property in the foreclosure process for over 3 years. Over 11% of the 2014 foreclosure market are zombies, these hot potato homes are ones the banks and the owners don't want.
Percent of distressed single family homes in the market
2012
2013
2013 2014
2014
1st half - 2nd half 1st
half 2nd
half 1st half
2nd half
Single family
Closed
Closed
Closed
Closed Closed
Closed
Arlington Heights 23% 14% 18% 10% 10% 7%
Mount Prospect 22% 20% 24% 14% 16.5% 9%
Palatine 29% 22% 18% 13% 18% 9%
Wheeling 60% 49% 52% 35% 40% 29%
Prospect Heights 58% 22% 25% 25% 24% 17%
Buffalo Grove 25% 23% 27% 18% 16% 10%
Rolling Meadows 33% 19% 25% 23% 35.5% 21%
Schaumburg 24% 28% 29 % 24% 21.5% 13%
Des Plaines 43% 40% 38% 28% 31% 17%
Elgin 63% 53% 55% 46 % 47% 31%
Hoffman Estates 36% 30% 36% 28% 31% 19%
Round Lake area 72% 73% 76% 61% 56% 39%
Long Grove, Kildeer,
and Lake
Zurich
28% 21%
23%
18%
14%
Barrington 16% 20% 20% 14% 16%
Park Ridge 16% 19% 16% 15% 10%
Hanover Park 68% 61% 58% 50% 46%
Bartlett 40% 36% 33% 26% 27%
Highland Park 14% 16% 15% 11% 9%
Glenview 23% 15% 14% 14% 15.5%
Glencoe 12% 7% 12% 5% 3%
Lake Forest 17% 10% 19% 6% 7%
Lake Bluff 25% 12% 20% 7% 12.5%
Wilmette 10% 6% 7% 3% 6%
Winnetka 7% 6% 4% 5% 4%
Kenilworth 16% 10% 4% 3% 0%
Evanston 12% 13% 13% 12% 18%
Vernon Hills 20% 21% 26% 15% 18%
Chicago (city limits) 46% 36% 45% 38% 32%
Rockford 59% 57% 65% 53% 63%
Island Lake 73% 65% 65% 49% 54%
Fox Lake 64% 42% 71% 44% 49%
Fox River Grove 45% 30% 28% 20%
Crystal Lake 43% 36% 42% 34% 33%
Carpentersville 69% 60% 63% 51% 40%
Addison 51% 32% 38% 40% 39%
Zion 84% 79% 83% 62% 67%
Aurora 55% 55% 54% 46% 46%
Calumet City
63%
60%
stats from MLSNI
1/14/2014
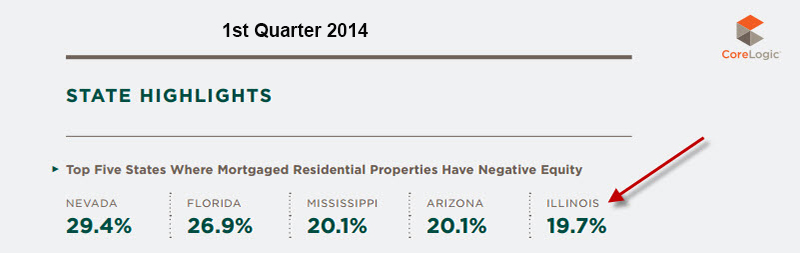
Illinois has one of the
nation's worst concentrations of deeply underwater homes,
but a rising residential market over the past year has
lifted some local homeowners out of the predicament,
according to a new report.
Nearly 775,000 Illinois
homeowners with a mortgage, or 32 percent in the state,
were "deeply underwater," or owned homes worth at least
25 percent less than their outstanding debt in December,
Irvine, Calif.-based RealtyTrac Inc. said today.
Only Nevada and Florida
fared worse, with 38 percent and 34 percent of homes
deeply underwater, respectively.
In the Chicago area about
33 percent, or 726,000 local homeowners with a mortgage,
were seriously underwater in December, down from 36
percent in May, RealtyTrac said.
The proportion of deeply underwater Illinois homeowners is down from 35 percent in January 2013 amid rising home values, RealtyTrac said. Nationally, the rate fell from 26 percent to 19 percent in 2013 Realty Trac said.
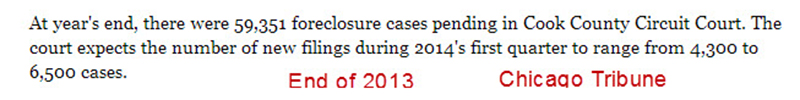
At
the end of 2010 there were 70,000 pending
foreclosure cases in Cook County. Since then,
foreclosures in the Chicago area have bogged down courts
even more. At the end of January, there were 77,000 cases
pending in Cook County Circuit Court.
It takes an
average of 697 days to complete a foreclosure action in
Illinois, according to RealtyTrac.
Under the new Illinois
Supreme Court rules, lenders also must submit detailed
documents at the start of the foreclosure process.
Lenders also will be required to follow certain
procedures to notify borrowers who have been found in
default on their mortgage and to notify them again that
the property is headed for sale.
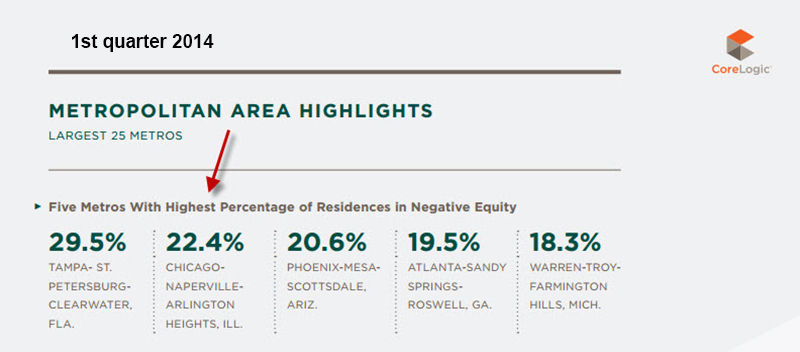
The number of Chicago-area homes worth less than their
debt rose at the end of the year, contradicting the trove
of data suggesting the local residential market is on the
path to recovery.
Research firm CoreLogic released a report today showing that 33.3 percent, or 506,838, of Chicago-area homes with a mortgage were “underwater” in the fourth quarter, up from 29.6 percent, or 451,250 properties, in the third quarter. The national rate moved in the opposite direction, dropping to 21.5 percent from 22 percent in the third quarter.
The average Chicago-area home with a mortgage had a loan that represented 78.6 percent of the value of the property, according to Irvine, Calif.-based CoreLogic.
The CoreLogic data belie the broader narrative of a rebounding housing market. Local home sales jumped 27 percent in 2012, and a key index of single-family home prices rose 2.2 percent.
Below Lender Processing Services reports a 21% increase in 30 day mortgage delinquencies in Chicago.
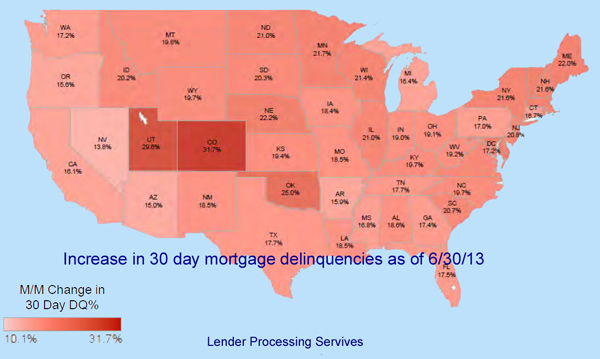


Of note is the fact that
foreclosure filings in the Chicago area took a big jump
in May 2012 over May 2011.
Dupage 160% increase
Kendall 94%
Kane
93%
Will
87%
Lake
71%
McHenry 58%
Cook
45%
These stats are from MLSNI.
Connect With Us
Contact us today for more information - 847.255.9346
IvyHillHomes@gmail.com